


News Releases
News Releases
| Su | Mo | Tu | We | Th | Fr | Sa |
|---|---|---|---|---|---|---|
| Su | Mo | Tu | We | Th | Fr | Sa |
|---|---|---|---|---|---|---|

 April 23, 2026
AGCO (NYSE: AGCO) today announced its Board of Directors approved an increase in the Company's regular quarterly dividend to $0.30 per share, from $0.29 per share. The Board also declared a...
- April 14, 2026
AGCO (NYSE: AGCO) today announced its first-quarter 2026 earnings release conference call is scheduled for Tuesday, May 5, at 10 a.m. ET. The company will refer to slides on its conference call....
 March 27, 2026
- AGCO
- Fendt
- Massey Ferguson
- North America
- Government/Municipality
- Heritage/Legacy
- Professional Farmer
- Tractors & Implements
- Machinery
- PTx
Iconic Fendt® golden tractor shines at White House event and celebrates farmers who feed the world. WASHINGTON, March 27, 2026 /PRNewswire/ -- AGCO (NYSE: AGCO) senior leaders joined President...
 March 16, 2026
Unified platform speeds ordering, improves accuracy and delivers real-time visibility so dealers work smarter and farmers get critical parts faster. DULUTH, Ga., March 16, 2026 /PRNewswire/ --...
- March 12, 2026
AGCO (NYSE: AGCO) today announced it will participate in the Bank of America Global Industrials Conference 2026 on Tuesday, March 17, 2026. The conference will include a fireside chat with Damon...
 March 12, 2026
New dealership to provide Wisconsin farmers access to Fendt®, Massey Ferguson® and PTx™ product lines, as well as on-farm service and support through AGCO's innovative FarmerCore™ model....
 March 11, 2026
AGCO (NYSE: AGCO) today announced the appointment of current AGCO Vice President of Aftersales Parts Jena Holtberg-Benge as the company's new Chief Digital & Information Officer (CDIO), effective...
 March 5, 2026
AGCO (NYSE: AGCO) today announced the appointment of James C. Collins, Jr. to its Board of Directors, effective April 1, 2026. Collins brings nearly four decades of leadership experience across...
 March 4, 2026
- AGCO
- Fendt
- North America
- Crop Care/Agronomy
- Precision Agriculture & Technology
- Professional Farmer
- Sustainability
- Technology
- Tractors & Implements
- Crop Care/Seeding & Tillage
- Precision Farming
- Machinery
- PTx
- PTx Trimble
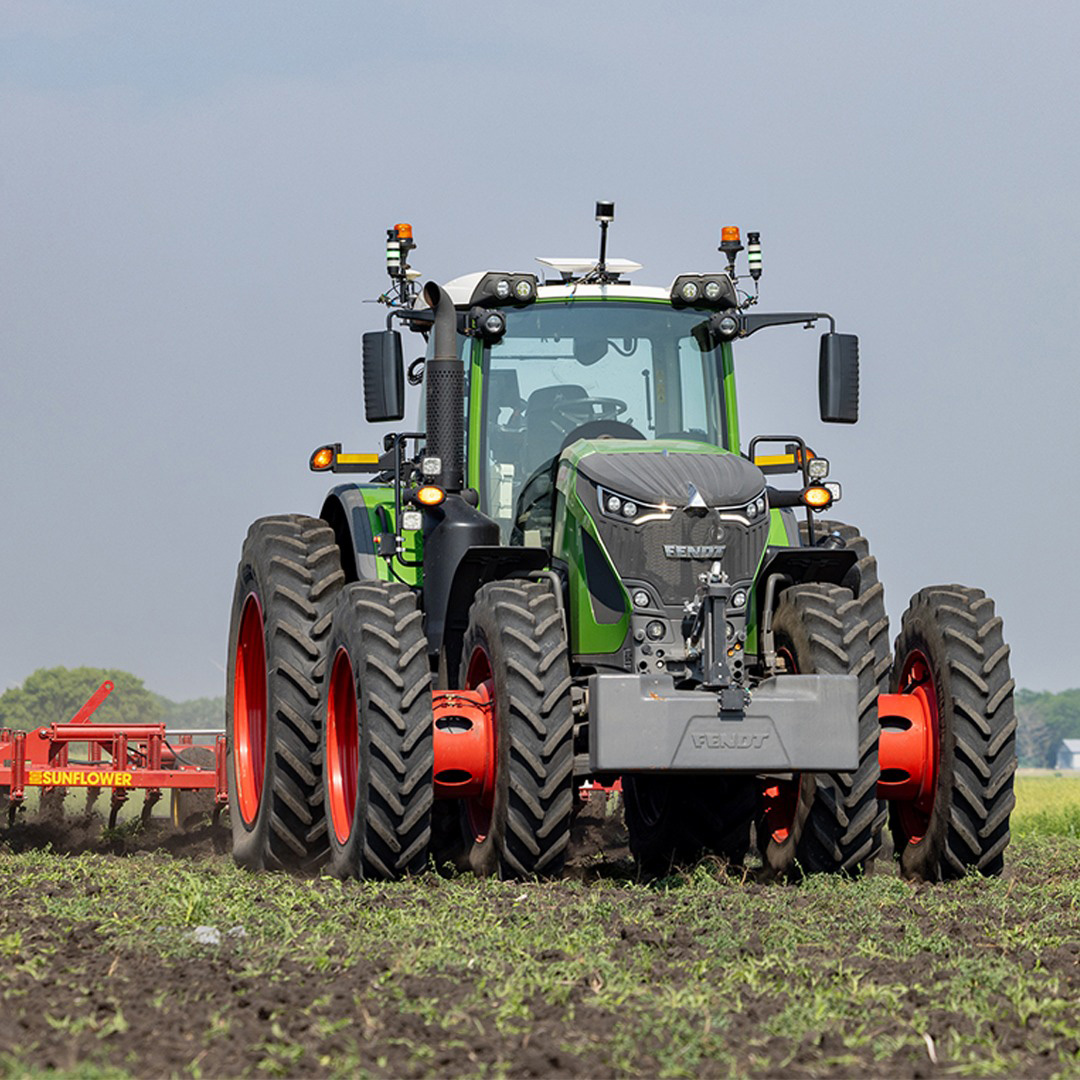
OutRun's second consecutive Davidson award highlights AGCO's progress toward full-farm autonomy by 2030. DULUTH, Ga., March 4, 2026 /PRNewswire/ -- AGCO's (NYSE: AGCO) OutRun™ | Tillage solution...
- March 2, 2026
AGCO (NYSE: AGCO) today announced that it will participate in the 2026 Morgan Stanley Technology, Media and Telecom Conference on Thursday, March 5, 2026. The conference will include a fireside...